CAT DILR Questions | CAT Line Chart & Bar Chart questions
This topic contains Caselet Based Problems on Line Chart; Bar Chart (Histogram); Mix of both. Solve these past year CAT questions. CAT Line Chart & Bar Chart | CAT Past Year DILR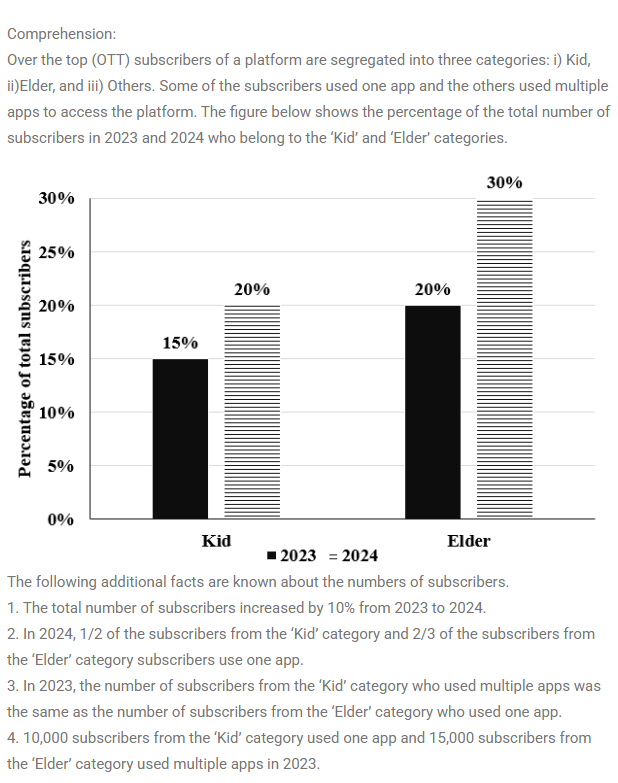
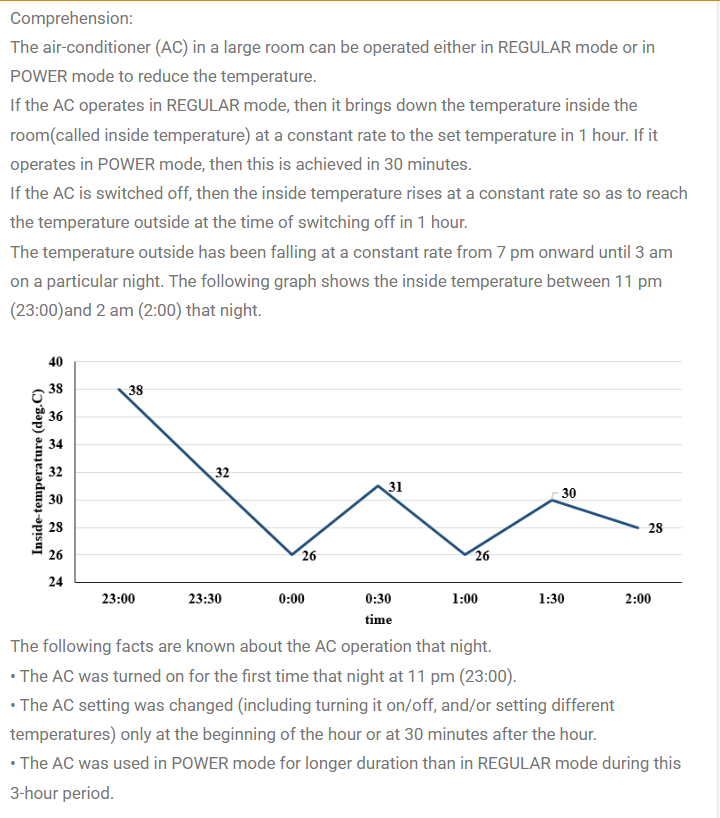
Comprehension
Directions for the Questions: Read the information carefully and answer the given questions accordingly.
Comprehension
The two plots below give the following information about six firms A, B, C, D, E, and F for 2019 and 2023.
PAT: The firm's profits after taxes in Rs. crores,
ES: The firm's employee strength, that is the number of employees in the firm, and
PRD: The percentage of the firm's PAT that they spend on Research and Development (R&D).
In the plots, the horizontal and vertical coordinates of point representing each firm gives their ES and PAT values respectively. The PRD values of each firm are proportional to the areas around the points representing each firm. The areas are comparable between the two plots, i.e., equal areas in the two plots represent the same PRD values for the two years.
Comprehension
Directions for the Questions: Read the information carefully and answer the given questions accordingly.
Six web surfers M, N, O, P, X, and Y each had 30 stars which they distributed among four bloggers A, B, C, and D. The number of stars received by A and B from the six web surfers is shown in the figure below.
The following additional facts are known regarding the number of stars received by the bloggers from the surfers.
1. The numbers of stars received by the bloggers from the surfers were all multiples of 5 (including 0).
2. The total numbers of stars received by the bloggers were the same.
3. Each blogger received a different number of stars from M.
4. Two surfers gave all their stars to a single blogger.
5. D received more stars than C from Y.
Comprehension
Directions for the Questions: Read the information carefully and answer the given questions accordingly.
The chart below provides complete information about the number of countries visited by Dheeraj, Samantha and Nitesh, in Asia, Europe and the rest of the world (ROW).
The following additional facts are known about the countries visited by them.
1. 32 countries were visited by at least one of them.
2. USA (in ROW) is the only country that was visited by all three of them.
3. China (in Asia) is the only country that was visited by both Dheeraj and Nitesh, but not by Samantha.
4. France (in Europe) is the only country outside Asia, which was visited by both Dheeraj and Samantha, but not by Nitesh.
5. Half of the countries visited by both Samantha and Nitesh are in Europe.
Comprehension
Directions for the Questions: Read the information carefully and answer the given questions accordingly.
The chart below shows the price data for seven shares – A, B, C, D, E, F, and G as a candlestick plot for a particular day. The vertical axis shows the price of the share in rupees. A share whose closing price (price at the end of the day) is more than its opening price (price at the start of the day) is called a bullish share; otherwise, it is called a bearish share. All bullish and bearish shares are shown in green and red colour respectively.
Comprehension
Directions for the questions: Read the information carefully and answer the given questions accordingly.
In the following, a year corresponds to 1st of January of that year.
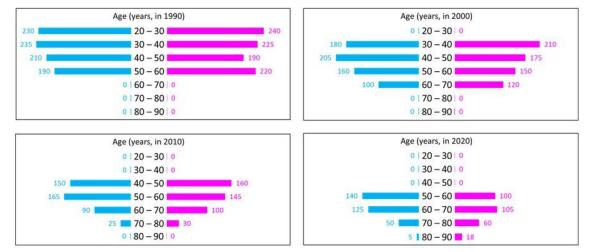
A study to determine the mortality rate for a disease began in 1980. The study chose 1000 males and 1000 females and followed them for forty years or until they died, whichever came first. The 1000 males chosen in 1980 consisted of 250 each of ages 10 to less than 20, 20 to less than 30, 30 to less than 40, and 40 to less than 50. The 1000 females chosen in 1980 also consisted of 250 each of ages 10 to less than 20, 20 to less than 30, 30 to less than 40, and 40 to less than 50.
The four figures below depict the age profile of those among the 2000 individuals who were still alive in 1990, 2000, 2010, and 2020. The blue bars in each figure represent the number of males in each age group at that point in time, while the pink bars represent the number of females in each age group at that point in time. The numbers next to the bars give the exact numbers being represented by the bars. For example, we know that 230 males among those tracked and who were alive in 1990 were aged between 20 and 30.
Comprehension
Directions for the questions: Read the information carefully and answer the given questions accordingly.
In the following, a year corresponds to 1st of January of that year.
A study to determine the mortality rate for a disease began in 1980. The study chose 1000 males and 1000 females and followed them for forty years or until they died, whichever came first. The 1000 males chosen in 1980 consisted of 250 each of ages 10 to less than 20, 20 to less than 30, 30 to less than 40, and 40 to less than 50. The 1000 females chosen in 1980 also consisted of 250 each of ages 10 to less than 20, 20 to less than 30, 30 to less than 40, and 40 to less than 50.
The four figures below depict the age profile of those among the 2000 individuals who were still alive in 1990, 2000, 2010, and 2020. The blue bars in each figure represent the number of males in each age group at that point in time, while the pink bars represent the number of females in each age group at that point in time. The numbers next to the bars give the exact numbers being represented by the bars. For example, we know that 230 males among those tracked and who were alive in 1990 were aged between 20 and 30.
Comprehension
Directions for the questions: Read the information carefully and answer the given questions accordingly.
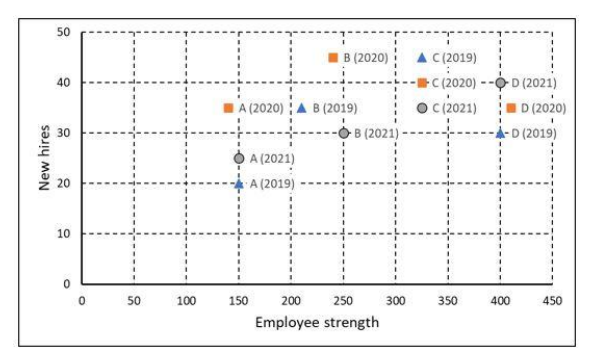
The two plots below show data for four companies code-named A, B, C, and D over three years - 2019, 2020, and 2021.
The first plot shows the revenues and costs incurred by the companies during these years. For example, in 2021, company C earned Rs.100 crores in revenue and spent Rs.30 crores. The profit of a company is defined as its revenue minus its costs.
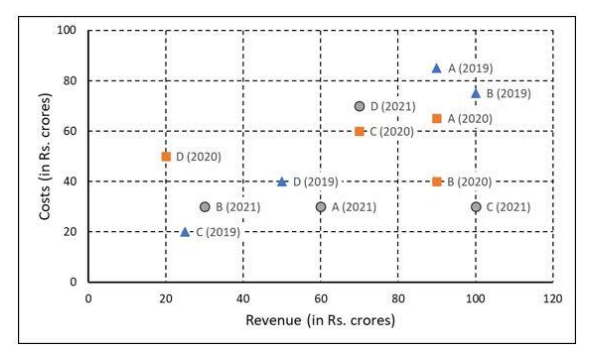
The second plot shows the number of employees employed by the company (employee strength) at the start of each of these three years, as well as the number of new employees hired each year (new hires). For example, Company B had 250 employees at the start of 2021, and 30 new employees joined the company during the year.
Comprehension
Directions for the questions: Read the information carefully and answer the given questions accordingly.
The two plots below show data for four companies code-named A, B, C, and D over three years - 2019, 2020, and 2021.
The first plot shows the revenues and costs incurred by the companies during these years. For example, in 2021, company C earned Rs.100 crores in revenue and spent Rs.30 crores. The profit of a company is defined as its revenue minus its costs.
The second plot shows the number of employees employed by the company (employee strength) at the start of each of these three years, as well as the number of new employees hired each year (new hires). For example, Company B had 250 employees at the start of 2021, and 30 new employees joined the company during the year.
CAT/2022.2(DILR)
Question. 35
Profit per employee is the ratio of a company's profit to its employee strength. For this purpose, the employee strength in a year is the average of the employee strength at the beginning of that year and the beginning of the next year. In 2020, which of the four companies had the highest profit per employee?
Comprehension
Directions for the questions: Read the information carefully and answer the given questions accordingly.
A speciality supermarket sells 320 products. Each of these products was either a cosmetic product or a nutrition product. Each of these products was also either a foreign product or a domestic product. Each of these products had at least one of the two approvals – FDA or EU.
The following facts are also known:
1. There were equal numbers of domestic and foreign products.
2. Half of the domestic products were FDA approved cosmetic products.
3. None of the foreign products had both the approvals, while 60 domestic products had both the approvals.
4. There were 140 nutrition products, half of them were foreign products.
5. There were 200 FDA approved products. 70 of them were foreign products and 120 of them were cosmetic products.
Comprehension
Directions for the questions: Read the information carefully and answer the given questions accordingly.
A few salesmen are employed to sell a product called TRICCEK among households in various housing complexes. On each day, a salesman is assigned to visit one housing complex. Once a salesman enters a housing complex, he can meet any number of households in the time available. However, if a household makes a complaint against the salesman, then he must leave the housing complex immediately and cannot meet any other household on that day. A household may buy any number of TRICCEK items or may not buy any item. The salesman needs to record the total number of TRICCEK items sold as well as the number of households met in each day. The success rate of a salesman for a day is defined as the ratio of the number of items sold to the number of households met on that day. Some details about the performances of three salesmen - Tohri, Hokli and Lahur, on two particular days are given below.
1. Over the two days, all three of them met the same total number of households, and each of them sold a total of 100 items.
2. On both days, Lahur met the same number of households and sold the same number of items.
3. Hokli could not sell any item on the second day because the first household he met on that day complained against him.
4. Tohri met 30 more households on the second day than on the first day.
5. Tohri’s success rate was twice that of Lahur’s on the first day, and it was 75% of Lahur’s on the second day.
Comprehension
Directions for the Questions: Read the information carefully and answer the given questions accordingly.
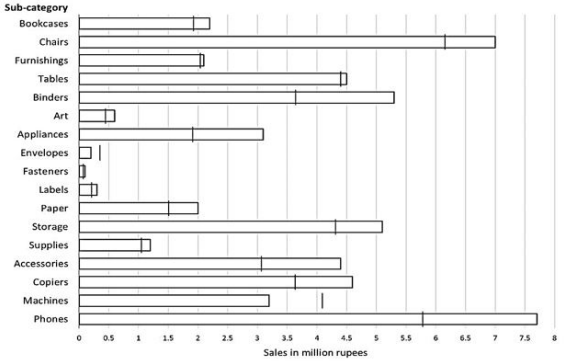
The horizontal bars in the above diagram represent the 2020 aggregate sales (in ₹ million) of a company for the different subcategories of its products. The top four product subcategories (Bookcases, Chairs, Furnishings, Tables) belong to the furniture product category; the bottom four product subcategories (Accessories, Copiers, Machines, Phones) belong to the technology product category while all other product subcategories belong to the office supply product category. For each of the product subcategories, there is a vertical line indicating the sales of the corresponding subcategory in 2019.
Comprehension
Directions for the Questions: Read the information carefully and answer the given questions accordingly.
The horizontal bars in the above diagram represent the 2020 aggregate sales (in ₹ million) of a company for the different subcategories of its products. The top four product subcategories (Bookcases, Chairs, Furnishings, Tables) belong to the furniture product category; the bottom four product subcategories (Accessories, Copiers, Machines, Phones) belong to the technology product category while all other product subcategories belong to the office supply product category. For each of the product subcategories, there is a vertical line indicating the sales of the corresponding subcategory in 2019.
Comprehension
Directions for the questions: Read the information carefully and answer the given questions accordingly.
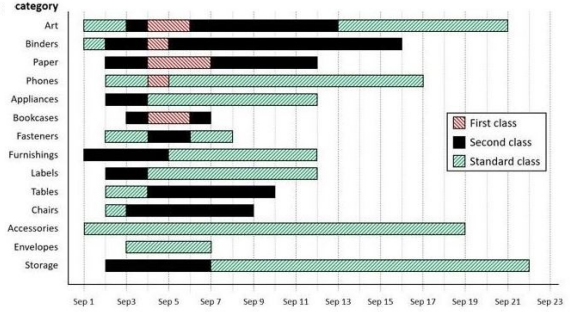
The different bars in the diagram above provide information about different orders in various categories (Art, Binders, ….) that were booked in the first two weeks of September of a store for one client. The colour and pattern of a bar denotes the ship mode (First Class / Second Class / Standard Class). The left end point of a bar indicates the booking day of the order, while the right end point indicates the dispatch day of the order. The difference between the dispatch day and the booking day (measured in terms of the number of days) is called the processing time of the order. For the same category, an order is considered for booking only after the previous order of the same category is dispatched. No two consecutive orders of the same category had identical ship mode during this period.
For example, there were only two orders in the furnishing category during this period. The first one was shipped in the Second Class. It was booked on Sep 1 and dispatched on Sep 5. The second order was shipped in the Standard class. It was booked on Sep 5 (although the order might have been placed before that) and dispatched on Sep 12. So the processing times were 4 and 7 days respectively for these orders.
Comprehension
Directions for the questions: Read the information carefully and answer the given questions accordingly.
The different bars in the diagram above provide information about different orders in various categories (Art, Binders, ….) that were booked in the first two weeks of September of a store for one client. The colour and pattern of a bar denotes the ship mode (First Class / Second Class / Standard Class). The left end point of a bar indicates the booking day of the order, while the right end point indicates the dispatch day of the order. The difference between the dispatch day and the booking day (measured in terms of the number of days) is called the processing time of the order. For the same category, an order is considered for booking only after the previous order of the same category is dispatched. No two consecutive orders of the same category had identical ship mode during this period.
For example, there were only two orders in the furnishing category during this period. The first one was shipped in the Second Class. It was booked on Sep 1 and dispatched on Sep 5. The second order was shipped in the Standard class. It was booked on Sep 5 (although the order might have been placed before that) and dispatched on Sep 12. So the processing times were 4 and 7 days respectively for these orders.
Comprehension
Directions for the Questions: Read the information carefully and answer the given questions accordingly.
The local office of the APP-CAB company evaluates the performance of five cab drivers, Arun, Barun, Chandan, Damodaran, and Eman for their monthly payment based on ratings in five different parameters (P1 to P5) as given below:
P1: timely arrival
P2: behaviour
P3: comfortable ride
P4: driver's familiarity with the route
P5: value for money
Based on feedback from the customers, the office assigns a rating from 1 to 5 in each of these parameters. Each rating is an integer from a low value of 1 to a high value of 5. The final rating of a driver is the average of his ratings in these five parameters. The monthly payment of the drivers has two parts – a fixed payment and final rating-based bonus. If a driver gets a rating of 1 in any of the parameters, he is not eligible to get bonus. To be eligible for bonus a driver also needs to get a rating of five in at least one of the parameters.
The partial information related to the ratings of the drivers in different parameters and the monthly payment structure (in rupees) is given in the table below: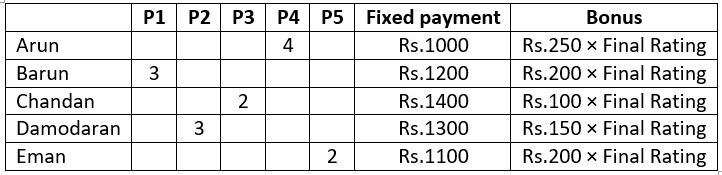
The following additional facts are known.
1. Arun and Barun have got a rating of 5 in exactly one of the parameters. Chandan has got a rating of 5 in exactly two parameters.
2. None of drivers has got the same rating in three parameters.
Comprehension
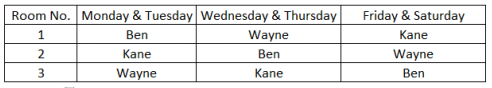
Three doctors, Dr. Ben, Dr. Kane and Dr. Wayne visit a particular clinic Monday to Saturday to see patients. Dr. Ben sees each patient for 10 minutes and charges Rs. 100/-. Dr. Kane sees each patient for 15 minutes and charges Rs. 200/-, while Dr. Wayne sees each patient for 25 minutes and charges Rs. 300/-. The clinic has three rooms numbered 1, 2 and 3 which are assigned to the three doctors as per the following table.
The clinic is open from 9 a.m. to 11.30 a.m. every Monday to Saturday.
On arrival each patient is handed a numbered token indicating their position in the queue, starting with token number 1 every day. As soon as any doctor becomes free, the next patient in the queue enters that emptied room for consultation. If at any time, more than one room is free then the waiting patient enters the room with the smallest number. For example, if the next two patients in the queue have token numbers 7 and 8 and if rooms numbered 1 and 3 are free, then patient with token number 7 enters room number 1 and patient with token number 8 enters room number 3.
Comprehension
Three doctors, Dr. Ben, Dr. Kane and Dr. Wayne visit a particular clinic Monday to Saturday to see patients. Dr. Ben sees each patient for 10 minutes and charges Rs. 100/-. Dr. Kane sees each patient for 15 minutes and charges Rs. 200/-, while Dr. Wayne sees each patient for 25 minutes and charges Rs. 300/-. The clinic has three rooms numbered 1, 2 and 3 which are assigned to the three doctors as per the following table.
The clinic is open from 9 a.m. to 11.30 a.m. every Monday to Saturday.
On arrival each patient is handed a numbered token indicating their position in the queue, starting with token number 1 every day. As soon as any doctor becomes free, the next patient in the queue enters that emptied room for consultation. If at any time, more than one room is free then the waiting patient enters the room with the smallest number. For example, if the next two patients in the queue have token numbers 7 and 8 and if rooms numbered 1 and 3 are free, then patient with token number 7 enters room number 1 and patient with token number 8 enters room number 3.
CAT/2019.2(DILR)
Question. 61
On a slow Thursday, only two patients are waiting at 9 a.m. After that two patients keep arriving at exact 15-minute intervals starting at 9:15 a.m. -- i.e. at 9:15 a.m., 9:30 a.m., 9:45 a.m. etc. Then the total duration in minutes when all three doctors are simultaneously free is
Comprehension
A large store has only three departments, Clothing, Produce, and Electronics. The following figure shows the percentages of revenue and cost from the three departments for the years 2016, 2017 and 2018. The dotted lines depict percentage levels. So for example, in 2016, 50% of store's revenue came from its Electronics department while 40% of its costs were incurred in the Produce department.
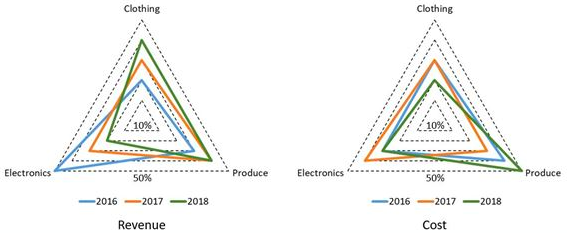
In this setup, Profit is computed as (Revenue - Cost) and Percentage Profit as Profit/Cost × 100%.
It is known that
1. The percentage profit for the store in 2016 was 100%.
2. The store’s revenue doubled from 2016 to 2017, and its cost doubled from 2016 to 2018.
3. There was no profit from the Electronics department in 2017.
4. In 2018, the revenue from the Clothing department was the same as the cost incurred in the Produce department.
Comprehension
A large store has only three departments, Clothing, Produce, and Electronics. The following figure shows the percentages of revenue and cost from the three departments for the years 2016, 2017 and 2018. The dotted lines depict percentage levels. So for example, in 2016, 50% of store's revenue came from its Electronics department while 40% of its costs were incurred in the Produce department.
In this setup, Profit is computed as (Revenue - Cost) and Percentage Profit as Profit/Cost × 100%.
It is known that
1. The percentage profit for the store in 2016 was 100%.
2. The store’s revenue doubled from 2016 to 2017, and its cost doubled from 2016 to 2018.
3. There was no profit from the Electronics department in 2017.
4. In 2018, the revenue from the Clothing department was the same as the cost incurred in the Produce department.
Comprehension
Simple Happiness index (SHI) of a country is computed on the basis of three parameters: social support (S), freedom to life choices (F) and corruption perception (C). Each of these three parameters is measured on a scale of 0 to 8 (integers only). A country is then categorized based on the total score obtained by summing the scores of ail the three parameters, as shown in the following table:
Following diagram depicts the frequency distribution of the scores in S, F and C of 10 countries - Amda, Benga, Calla, Delma, Eppa, Varsa, Wanna, Xanda, Yanga and Zooma: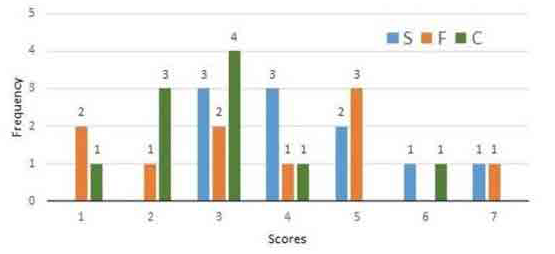
Further, the following are known:
1.Amda and Calla jointly have the lowest total score, 7, with identical scores in all the three parameters.
2.Zooma has a total score of 17.
3.All the 3 countries, which categorised as happy, have the highest score in exactly one parameter.
Comprehension
In a square layout of size 5m × 5m, 25 equal sized square platforms of different heights are built. The heights (in metres) of individual platforms are as shown below:
Individuals (all of same height) are seated on these platforms. We say an individual A can reach an individual B if all the three following conditions are met:
i.) A and B are In the same row or column
ii.) A is at a lower height than B
iii.) If there is/are any individual(s) between A and B, such individual(s) must be at a height lower than that of A.
Thus in the table given above, consider the Individual seated at height 8 on 3rd row and 2nd column. He can be reached by four individuals. He can be reached by the individual on his left at height 7, by the two individuals on his right at heights of 4 and 6 and by the individual above at height 5. Rows in the layout are numbered from top to bottom and columns are numbered from left to right.
Comprehension
Directions for the questions: Read the information carefully and answer the given questions accordingly.
At a management school, the oldest 10 dorms, numbered 1 to 10, need to be repaired urgently, The diagram represents the estimated repair costs (in Rs. Crores) for the 10 dorms. For any dorm, the estimated repair cost (in Rs. Crores) is an integer. Repairs with estimated cost Rs. 1 or 2 Crores are considered light repairs, repairs with estimated cost Rs. 3 or 4 are considered moderate repairs and repairs with estimated cost Rs. 5 or 6 Crores are considered extensive repairs.
Further, the following are known:
1. Odd-numbered dorms do not need light repair; even-numbered dorms do not need moderate repair and dorms, whose numbers are divisible by 3, do not need extensive repair.
2. Dorms 4 to 9 all need different repair costs, with Dorm 7 needing the maximum and Dorm 8 needing the minimum.
Comprehension
Directions for Questions: Answer the following questions based on the information given below :
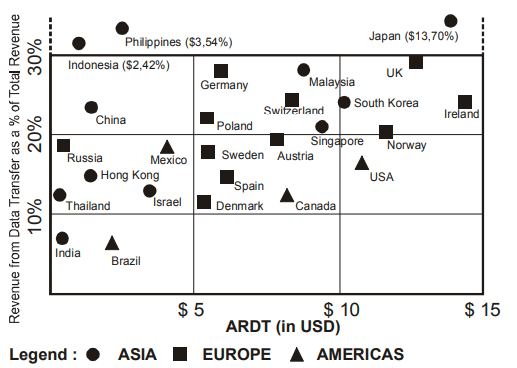
Telecom operators get revenue from transfer of data and voice. Average revenue received from transfer of each unit of data is known as ARDT. In the diagram below, the revenue received from data transfer as percentage of total revenue received and the ARDT in US Dollars (USD) are given for various countries.
CAT/2008(DILR)
Question. 78
It was found that the volume of data transfer in India is the same as that of Singapore. Then which of the following statements is true?
Comprehension
Directions for Questions: Answer the following questions based on the information given below :
Telecom operators get revenue from transfer of data and voice. Average revenue received from transfer of each unit of data is known as ARDT. In the diagram below, the revenue received from data transfer as percentage of total revenue received and the ARDT in US Dollars (USD) are given for various countries.
CAT/2008(DILR)
Question. 79
It is expected that by 2010, revenue from data transfer as a percentage of total revenue will triple for India and double for Sweden. Assume that in 2010, the total revenue in India is twice that of Sweden and that the volume of data transfer is the same in both the countries. What is the percentage increase of ARDT in India if there is no change in ARDT in Sweden?
Comprehension
Directions for Questions: Answer the following questions based on the information given below :
Telecom operators get revenue from transfer of data and voice. Average revenue received from transfer of each unit of data is known as ARDT. In the diagram below, the revenue received from data transfer as percentage of total revenue received and the ARDT in US Dollars (USD) are given for various countries.
Comprehension
Directions for Questions: Answer the following questions based on the information given below:
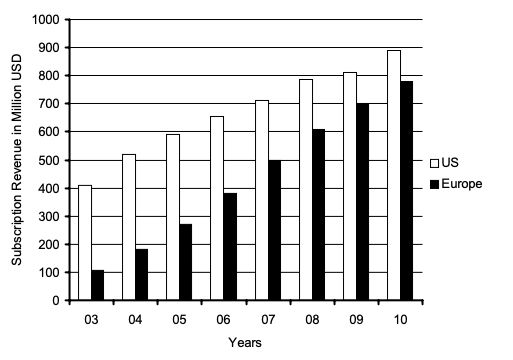
The bar chart below shows the revenue received, in million US Dollars (USD), from subscribers to a particular Internet service. The data covers the period 2003 to 2007 for the United States (US) and Europe. The bar chart also shows the estimated revenues from subscription to this service for the period 2008 to 2010.

Comprehension
Directions for Questions: Answer the following questions based on the information given below:
The bar chart below shows the revenue received, in million US Dollars (USD), from subscribers to a particular Internet service. The data covers the period 2003 to 2007 for the United States (US) and Europe. The bar chart also shows the estimated revenues from subscription to this service for the period 2008 to 2010.
CAT/2008(DILR)
Question. 82
In 2003, sixty percent of subscribers in Europe were men. Given that women subscribers increase at the rate of 10 percent per annum and men at the rate of 5 percent per annum, what is the approximate percentage growth of subscribers between 2003 and 2010 in Europe? The subscription prices are volatile and may change each year.
Comprehension
Directions for Questions: Answer the following questions based on the information given below:
The bar chart below shows the revenue received, in million US Dollars (USD), from subscribers to a particular Internet service. The data covers the period 2003 to 2007 for the United States (US) and Europe. The bar chart also shows the estimated revenues from subscription to this service for the period 2008 to 2010.
Comprehension
Answer the following questions based on the information given below:
There are 100 employees in an organization across five departments. The following table gives the department-wise distribution of average age, average basic pay and allowances. The gross pay of an employee is the sum of his/her basic pay and allowances.
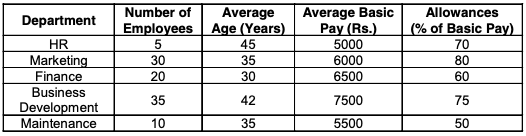
There are limited numbers of employees considered for transfer/promotion across departments. Whenever a person is transferred/promoted from a department of lower average age to a department of higher average age, he/she will get an additional allowance of 10% of basic pay over and above his/her current allowance. There will not be any change in pay structure if a person is transferred/promoted from a department with higher average age to a department with lower average age.
Questions below are independent of each other.
Comprehension
Answer the following questions based on the information given below:
There are 100 employees in an organization across five departments. The following table gives the department-wise distribution of average age, average basic pay and allowances. The gross pay of an employee is the sum of his/her basic pay and allowances.
There are limited numbers of employees considered for transfer/promotion across departments. Whenever a person is transferred/promoted from a department of lower average age to a department of higher average age, he/she will get an additional allowance of 10% of basic pay over and above his/her current allowance. There will not be any change in pay structure if a person is transferred/promoted from a department with higher average age to a department with lower average age.
Questions below are independent of each other.
CAT/2008(DILR)
Question. 86
There was a mutual transfer of an employee between Marketing and Finance departments and transfer of one employee from Marketing to HR. As a result, the average age of Finance department increased by one year and that of Marketing department remained the same. What is the new average age of HR department?
Comprehension
Answer the following questions based on the information given below:
There are 100 employees in an organization across five departments. The following table gives the department-wise distribution of average age, average basic pay and allowances. The gross pay of an employee is the sum of his/her basic pay and allowances.
There are limited numbers of employees considered for transfer/promotion across departments. Whenever a person is transferred/promoted from a department of lower average age to a department of higher average age, he/she will get an additional allowance of 10% of basic pay over and above his/her current allowance. There will not be any change in pay structure if a person is transferred/promoted from a department with higher average age to a department with lower average age.
Questions below are independent of each other.
CAT/2008(DILR)
Question. 87
If two employees (each with a basic pay of Rs. 6000) are transferred from Maintenance department to HR department and one person (with a basic pay of Rs. 8000) was transferred from Marketing department to HR department, what will be the percentage change in average basic pay of HR department?
Comprehension
Directions for Questions: Answer the following questions based on the information given below:
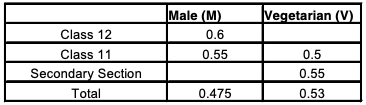
The proportion of male students and the proportion of vegetarian students in a school are given below. The school has a total of 800 students, 80% of whom are in the Secondary Section and rest are equally divided between Class 11 and 12.
Comprehension
Directions for Questions: Answer the following questions based on the information given below:
The proportion of male students and the proportion of vegetarian students in a school are given below. The school has a total of 800 students, 80% of whom are in the Secondary Section and rest are equally divided between Class 11 and 12.
CAT/2007(DILR)
Question. 91
In the Secondary Section, 50% of the students are vegetarian males. Which of the following statements is correct?
(1) Except vegetarian males, all other groups have same number of students
(2) Except non-vegetarian males, all other groups have same number of students.
(3) Except vegetarian females, all other groups have same number of students.
(4) Except non-vegetarian females, all other groups have same number of students.
(5) All of the above groups have the same number of students.
Comprehension
Directions for Question: Answer the question on the basis of the information given below.
A management institute was established on January I, 2000 with 3, 4, 5, and 6 faculty members in the Marketing, Organisational Behaviour (OB), Finance, and Operations Management (OM) areas respectively, to start with. No faculty member retired or joined the institute in the first three months of the year 2000. In the next four years, the institute recruited one faculty member in each of the four areas. All these new faculty members, who joined the institute subsequently over the years, were 25 years old at the time of their joining the institute. All of them joined the institute on April 1. During these four years, one of the faculty members retired at the age of 60. The following diagram gives the area-wise average age (in terms of number of completed years) of faculty members as on April 1 of 2000, 2001, 2002 and 2003.
CAT/2005(DILR)
Question. 95
Professors Naresh and Devesh, two faculty members in the Marketing area, who have been with the Institute since its inception, share a birthday, which falls on 20th November. One was, born in 1947 and the other one in 1950. On April 1, 2005, what was the age of the third faculty member, who has been in the same area since inception?

Comprehension
Directions for Questions: Answer the questions on the basis of the information given below.
Purana and Naya are two brands of kitchen mixer- grinders available in the local market. Purana is an old brand that was introduced in 1990, while Naya was introduced in 1997. For both these brands, 20% of the mixer-grinders bought in a particular year are disposed off as junk exactly two years later. It is known that 10 Purana mixer-grinders were disposed off in 1997. The following figures show the number of Purana and Naya mixer-grinders in operation from 1995 to 2000, as at the end of the year.
Comprehension
Directions for Questions: These questions are based on the information and graph given below.
Each point in the graph below shows the profit and turnover data of a company. Each company belongs to one of the three industries: textile, cement and steel.

Comprehension
Directions for Questions: These questions are based on the information and graph given below.
Each point in the graph below shows the profit and turnover data of a company. Each company belongs to one of the three industries: textile, cement and steel.
Comprehension
Directions for Questions: These questions are based on the information and graph given below.
The length of an infant is one of the measures of his/her development in the early stages of his /her life. The figure below shows the growth chart of four infants in the five months of life.


Comprehension
Directions for Questions: These questions are based on the information and charts given below.
The profitability of a company is defined as the ratio of its operating profit to its operating income, typically expressed in percentage. The following two charts show the operating income as well as the profitability of six companies in the Financial Years (F. Y.s) 2001-02 and 2002-03.

The operating profits of four of these companies are plotted against their respective operating income figures for the F. Y. 2002- 03, in the third chart given below.

Comprehension
Directions for Questions: These questions are based on the information and charts given below.
The profitability of a company is defined as the ratio of its operating profit to its operating income, typically expressed in percentage. The following two charts show the operating income as well as the profitability of six companies in the Financial Years (F. Y.s) 2001-02 and 2002-03.
The operating profits of four of these companies are plotted against their respective operating income figures for the F. Y. 2002- 03, in the third chart given below.


Comprehension
Directions for Questions: These questions are based on the information and two graphs given below.
Figure 1 shows the amount of work distribution , in man - hours for a software company between offshore and onsite activities. Figure 2 shows the estimated and actual work effort involved in the different offshore activities in the same company during the same period. [Note : onsite refers to work performed at the customer’s premise and offshore refers to work performed at the developer’s premise.]
CAT/2001(DILR)
Question. 134
If 50 percent of the offshore work were to be carried out onsite, with the distribution of effort between the tasks remaining the same, which of the following is true of all work carried out onsite?
Comprehension
Directions for Questions: These questions are based on the information and graph given below
There are six companies, 1 through 6. All of these companies use six operations, A through F. The following graph shows the distribution of efforts put in by each company in these six operations.
Comprehension
Directions for Questions: These questions are based on the information and graph given below
The following graph gives the data of four of the commodities produced by a company. Manufacturing constitutes 20% Mining 15%, Electricity 10% and Chemicals 15% of its production. The graph gives the percentage change in production over the previous years’s production and 1989 production values have been assigned an index of 100 for each of the four commodities.

Comprehension
Directions for Questions: These questions are based on the information and graph given below
These questions are based on the price fluctuations of four commodities - arhar, pepper, sugar, and gold during February - july 1999 as described in the figures below :

Comprehension
Directions for Questions: These questions are based on the information and graph given below
These questions are based on the price fluctuations of four commodities - arhar, pepper, sugar, and gold during February - july 1999 as described in the figures below :
Comprehension
Directions for Questions: These questions are based on the information and graph given below
These questions are based on the price fluctuations of four commodities - arhar, pepper, sugar, and gold during February - july 1999 as described in the figures below :
Comprehension
Directions for Questions: These questions are based on the information and graph given below
These questions are based on the price fluctuations of four commodities - arhar, pepper, sugar, and gold during February - july 1999 as described in the figures below :
Comprehension
Directions for Questions: These questions are based on the information and graph given below
The following graph gives the data about Foreign Equity Inflow Index (FEII) for the four countries for two years 97 and 98. FEII is taken as the ratio of foreign equity inflow (FEI) to the country’s GDP, which is expressed as percentage in the graph, For answering you can use the data from the preceding questions.
CAT/1999(DILR)
Question. 154
If GDP of India increase by 5%, China increase by 7% and Korea decrease By 2% from year 97 to 98. Which of the following is/ are -true?
I. Net investment in China has increased.
II. Net investment in China has decreased
III. India’s FEI in absolute terms has increased.
IV. Net investment in Malaysia has increased.
V. Korea’s FEI in absolute terms has increased.
Comprehension
Directions for Questions: These questions are based on the information and graph given below
The following graph gives the data about Foreign Equity Inflow Index (FEII) for the four countries for two years 97 and 98. FEII is taken as the ratio of foreign equity inflow (FEI) to the country’s GDP, which is expressed as percentage in the graph, For answering you can use the data from the preceding questions.
Comprehension
Directions for Questions: These questions are based on the information and graph given below
Ghosh Babu has a manufacturing unit. The following graph gives the cost for various number of units. Given the Profit = Revenue - Variable Cost - Fixed Cost. The fixed cost remains constant upto 34 units after which additional investment is to be done in fixed assets. In any case production can not exceed 50 units. 
Comprehension
Directions for Questions: These questions are based on the information and graph given below
Ghosh Babu has a manufacturing unit. The following graph gives the cost for various number of units. Given the Profit = Revenue - Variable Cost - Fixed Cost. The fixed cost remains constant upto 34 units after which additional investment is to be done in fixed assets. In any case production can not exceed 50 units.
Comprehension
Directions for Questions: These questions are based on the information and chart given below
In the following chart, the price of logs shown is per cubic meter and that of plywood and saw timber is per ton. Given that 1 cubic meter of Plywood and Saw Timber = 800 kg. (1 ton = 1000 kg )


Comprehension
Directions for Questions: These questions are based on the information and graph given below
The following bar chart gives the percentage growth in households in the middle, upper middle and high income categories in the four regions for the period between 87-88 to 94-95.

Comprehension
Directions for Questions: These questions are based on the information and graph given below
The following bar chart gives the percentage growth in households in the middle, upper middle and high income categories in the four regions for the period between 87-88 to 94-95.
Comprehension
Directions for Questions: These questions are based on the information and graph given below
The following bar chart gives the percentage growth in households in the middle, upper middle and high income categories in the four regions for the period between 87-88 to 94-95.


CAT/1995(DILR)
Question. 198
Which of the following statements can be inferred from the graph?
I. In all the years shown in graph, the trade deficit is less than the export earning
II. export earnings increased in every year between 89-90 and 91-92.
III. In all the years shown in the graph, the earning by exports is less than the expenditure on imports in the preceding year.


