CAT DILR Questions | CAT Pie Charts questions
PIE CHART — Caselet Based Problems on Pie Chart. Every year 1 caselet is asked from this topic in CAT. Solve CAT Pie Chart | CAT Past Year DILR QuestionsComprehension
Directions for questions: Read the given instructions carefully and answer the questions accordingly.
Five vendors are being considered for a service. The evaluation committee evaluated each vendor on six aspects – Cost, Customer Service, Features, Quality, Reach, and Reliability. Each of these evaluations are on a scale of 0 (worst) to 100 (perfect). The evaluation scores on these aspects are shown in the radar chart. For example, Vendor 1 obtains a score of 52 on Reliability, Vendor 2 obtains a score of 45 on Features and Vendor 3 obtains a score of 90 on Cost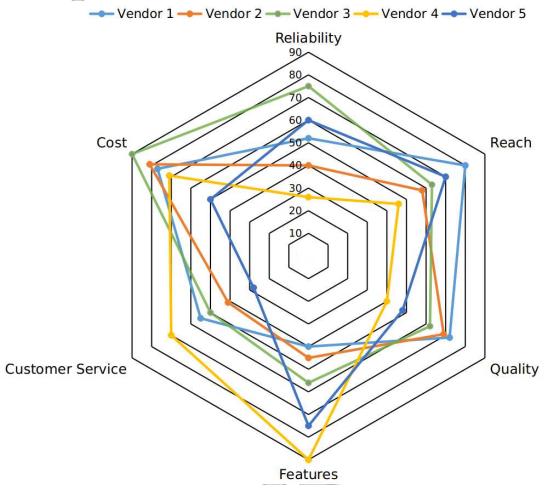
Comprehension
Directions for questions: Read the given instructions carefully and answer the questions accordingly.
The Ministry of Home Affairs is analysing crimes committed by foreigners in different states and union territories (UT) of India. All cases refer to the ones registered against foreigners in 2016. The number of cases – classified into three categories: IPC crimes, SLL crimes and other crimes – for nine states/UTs are shown in the figure below. These nine belong to the top ten states/UTs in terms of the total number of cases registered. The remaining state (among top ten) is West Bengal, where all the 520 cases registered were SLL crimes.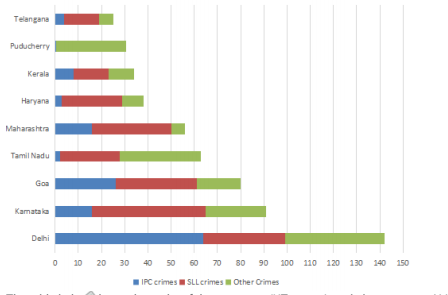
The table below shows the ranks of the ten states/UTs mentioned above among ALL states/UTs of India in terms of the number of cases registered in each of the three category of crimes. A state/UT is given rank r for a category of crimes if there are (r‐1) states/UTs having a larger number of cases registered in that category of crimes. For example, if two states have the same number of cases in a category, and exactly three other states/UTs have larger numbers of cases registered in the same category, then both the states are given rank 4 in that category. Missing ranks in the table are denoted by *
Comprehension
The multi-layered pie-chart below shows the sales of LED television sets for a big retail electronics outlet during 2016 and 2017. The outer layer shows the monthly sales during this period, with each label showing the month followed by sales figure of that month. For some months, the sales figures are not given in the chart. The middle-layer shows quarter-wise aggregate sales figures (in some cases, aggregate quarter-wise sales numbers are not given next to the quarter). The innermost layer shows annual sales. It is known that the sales figures during the three months of the second quarter (April, May, June) of 2016 form an arithmetic progression, as do the three monthly sales figures in the fourth quarter (October, November, December)of that year.
Comprehension
Directions for Questions : Refer to the pie-charts given below and answer the questions that follow :

Chart 1 shows the distribution by value of top 6 suppliers of MFA Textiles in 1995. Chart 2 shows the distribution by quantity of top 6 suppliers of MFA Textiles in 1995. The total value is 5760 million Euro (European currency). The total quantity is 1.055 million tonnes.
Comprehension
Directions for Questions : Refer to the pie-charts given below and answer the questions that follow :
Chart 1 shows the distribution by value of top 6 suppliers of MFA Textiles in 1995. Chart 2 shows the distribution by quantity of top 6 suppliers of MFA Textiles in 1995. The total value is 5760 million Euro (European currency). The total quantity is 1.055 million tonnes.
Comprehension
Directions for Questions: Refer to the pie-charts given below and answer the questions that follow :
Chart 1 shows distribution of twelve million tonnes of crude oil transported through different modes over a specific period of time. Chart 2 shows the distribution of the cost of transporting this crude oil. The total cost was Rs. 30 million.
Comprehension
Directions for Questions: Refer to the information and pie-charts given below and answer the questions that follow :
Consider the information provided in the figure below relating to India’s foreign trade in 1997-98 and the first eight months of 1998-99. Total trade with a region is defined as the sum of exports to and imports from that region. Trade deficit is defined as the excess of imports over exports. Trade deficit may be negative.
Comprehension
ADDITIONAL Directions for Questions: Refer to the information given below and answer the questions that follow :
Assume that the average monthly exports from India and imports to India during the remaining four months of 1998-99 would be the same as that for the first eight months of the year.
Comprehension
Directions for Questions : Refer to the pie-chart given below and answer the questions that follow :

